BIOGRAPHICA
THE QUESTION - A complex graphic began with a simple question: How long ago did Pericles live?
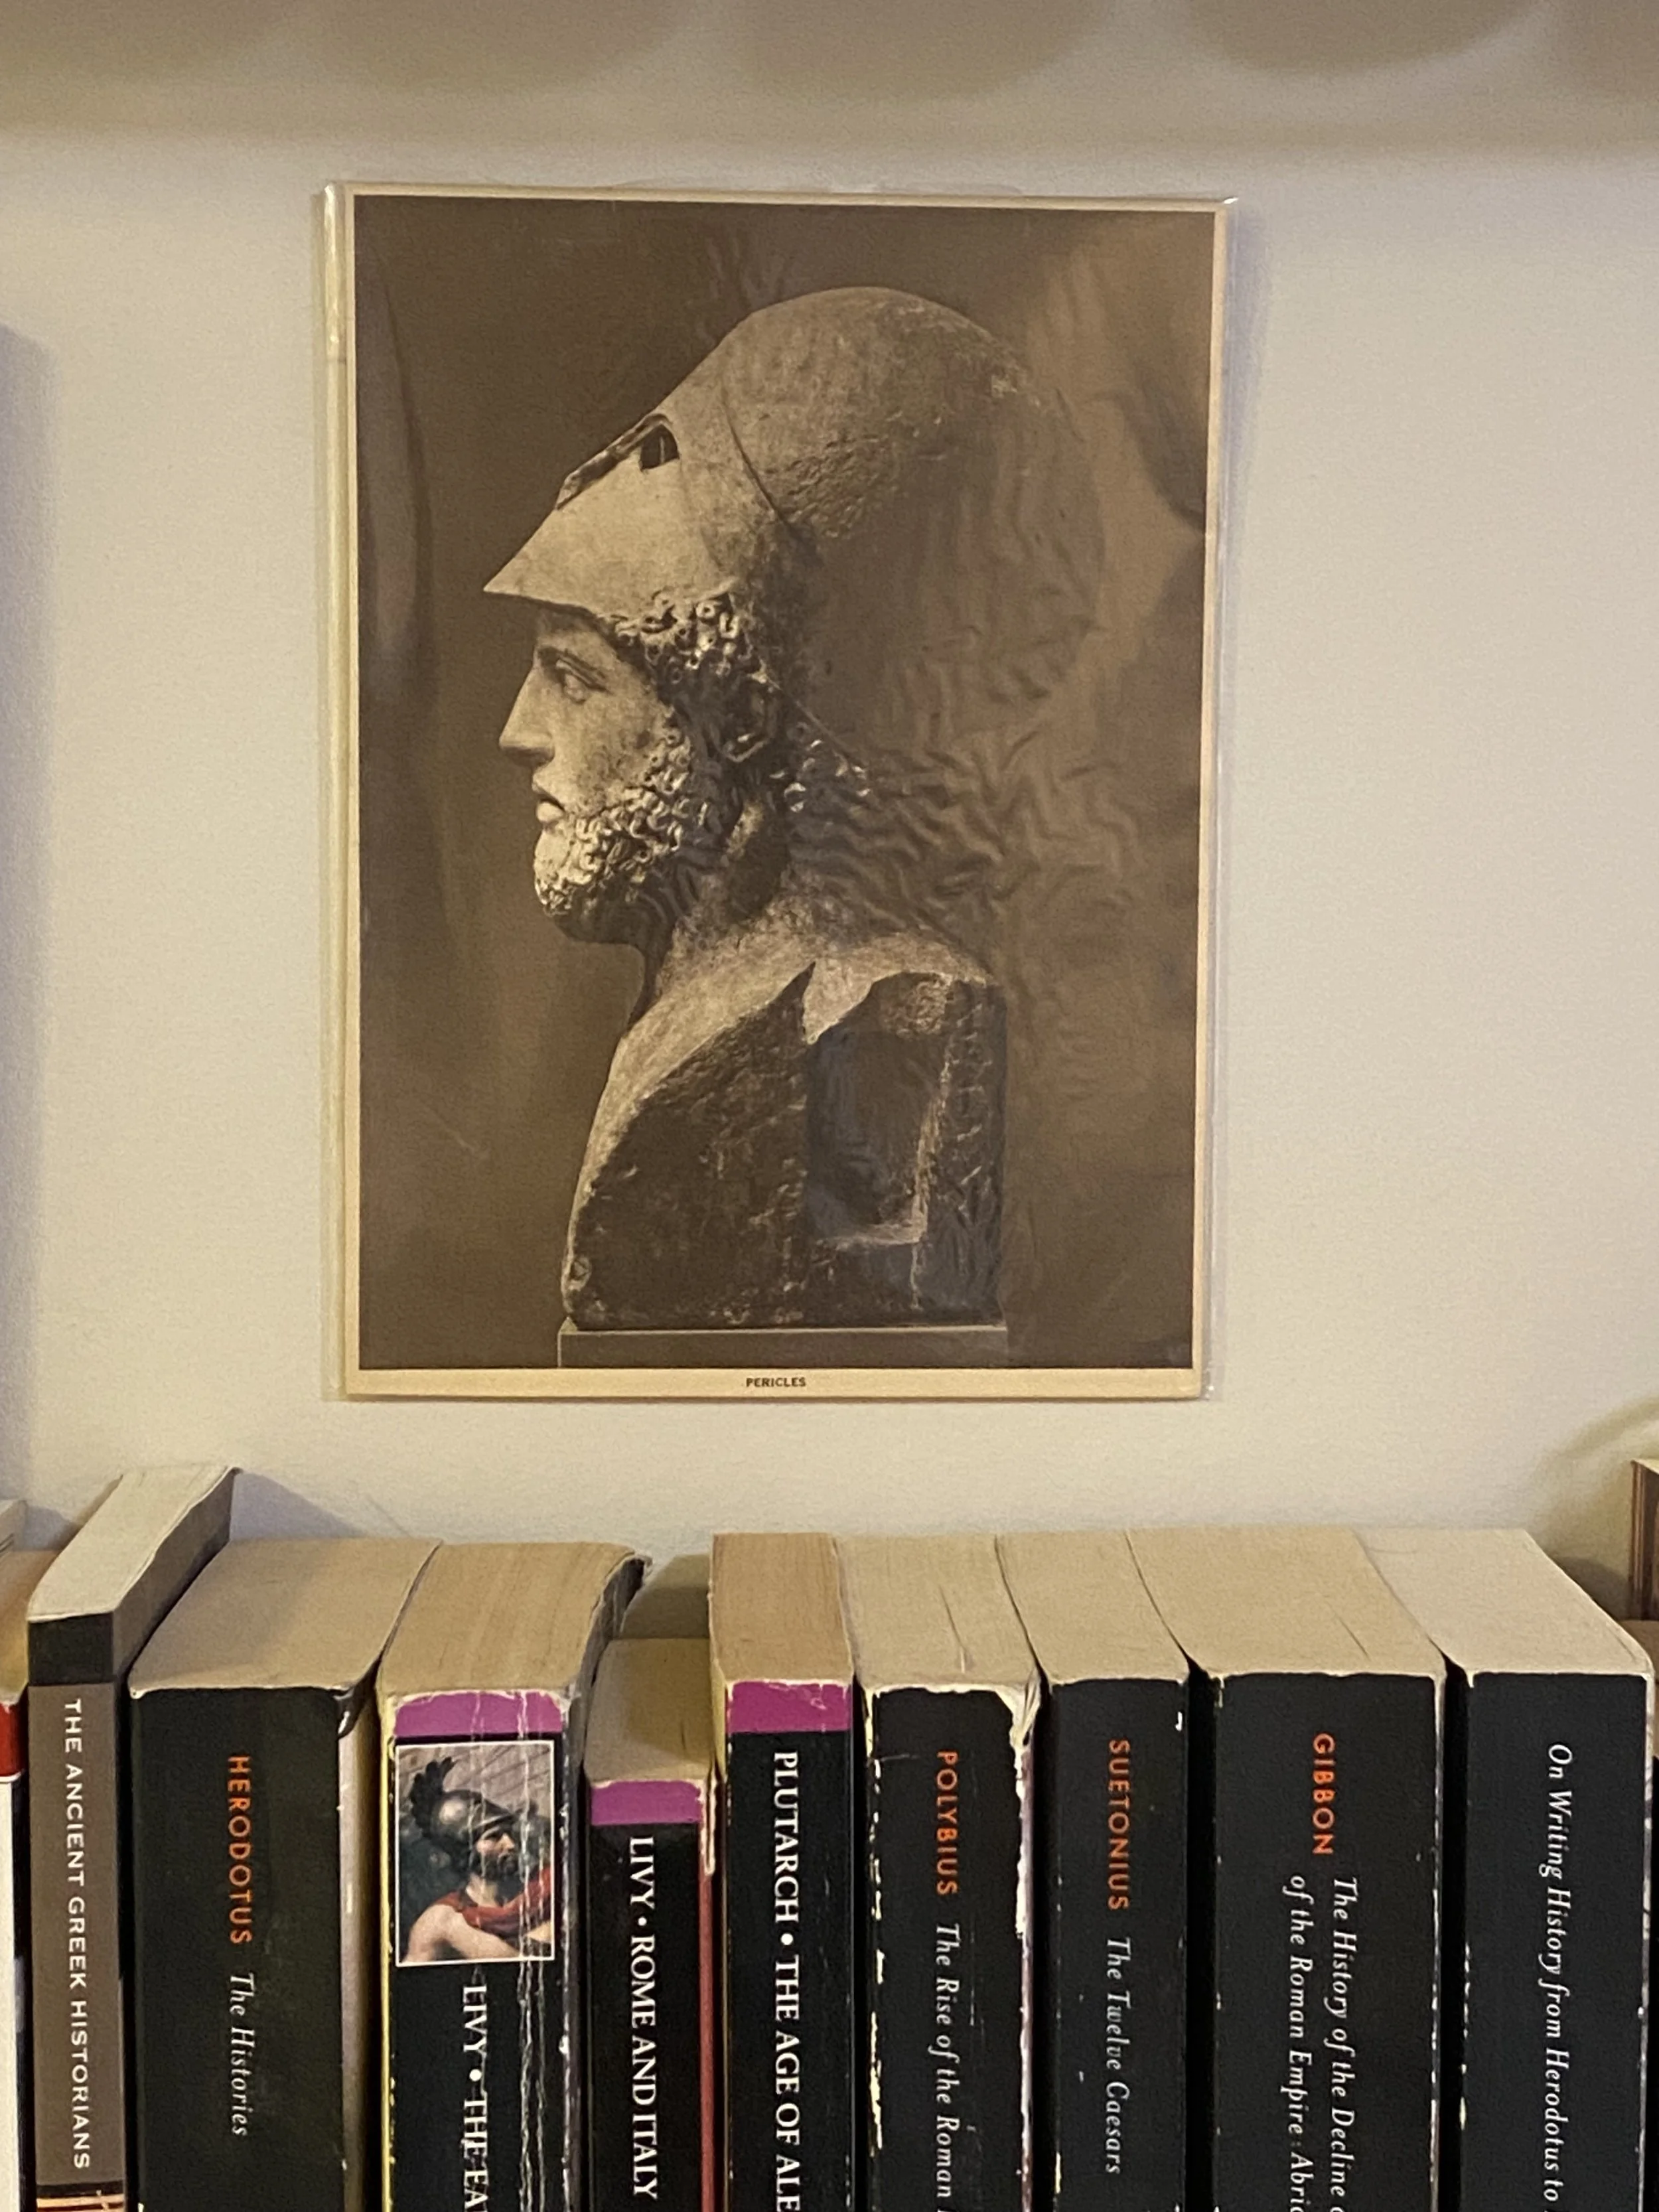
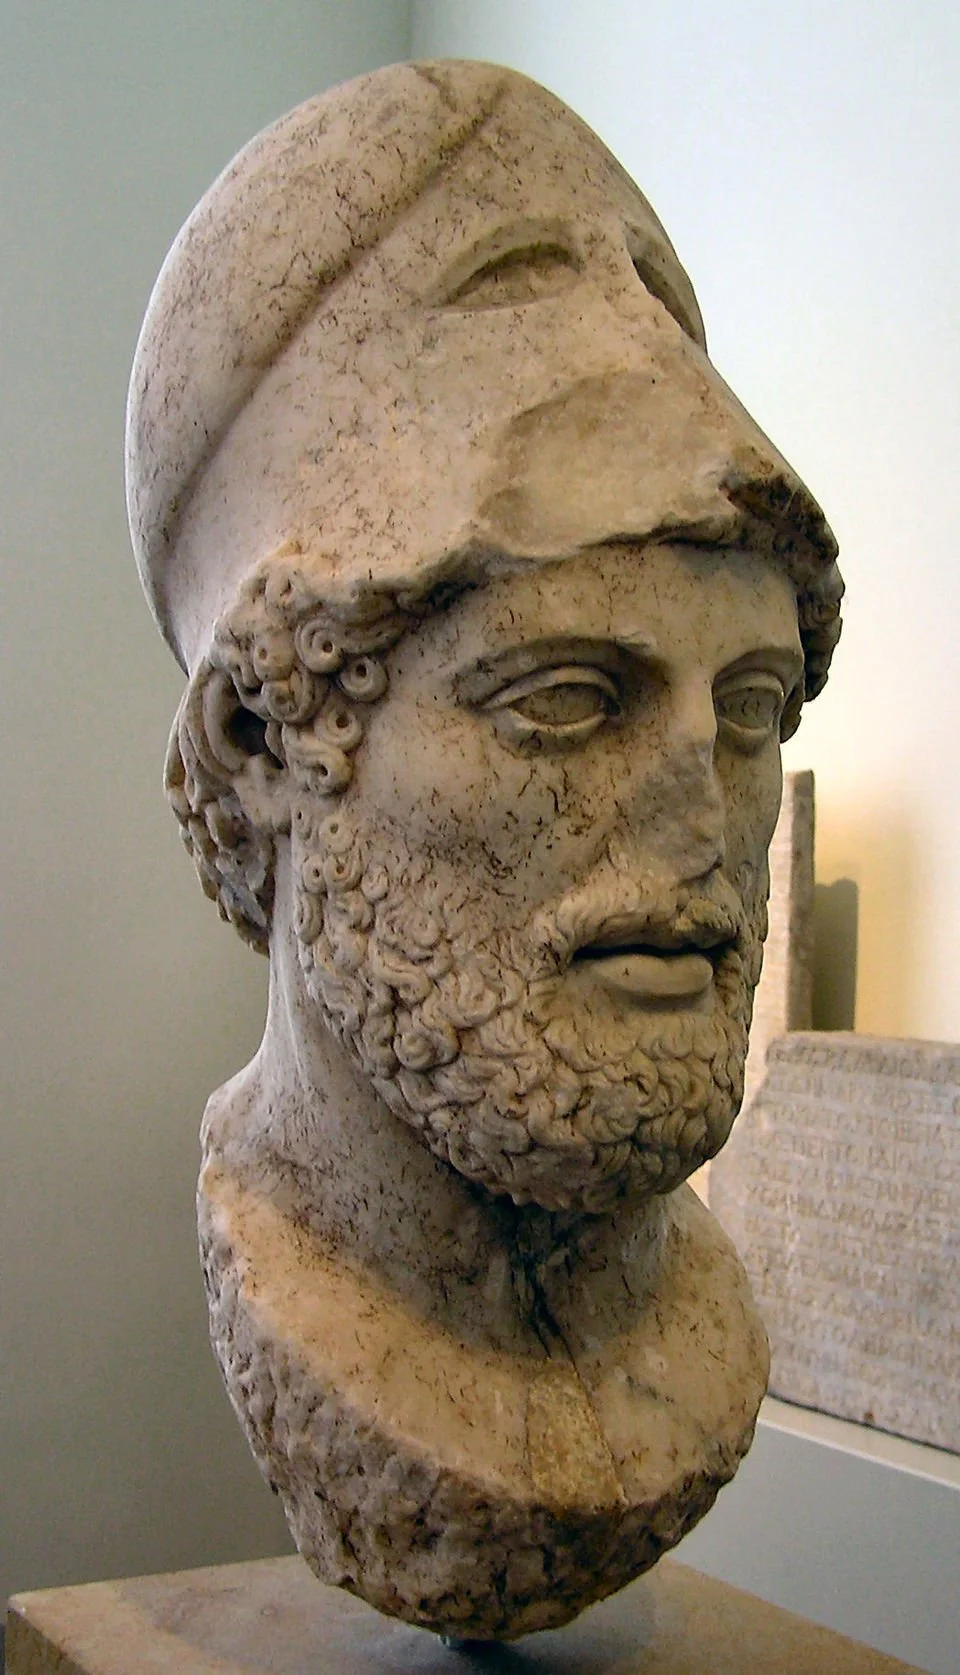
In August 2009, I stood in the Altes Museum in Berlin studying the bust of the father of Athenian democracy. The plaque below it explained that this artifact is a Roman copy from the 1st century, based on an original dating from 429 BC.
While I understood the historic statesman lived nearly two and a half millennia before my own time, I couldn’t quite wrap my head around that span. Rather than framing the distance in years, I decided to think about it on a human scale — how many generations ago did Pericles live?
Presuming a generation is 25 years, the answer became nice and round. Pericles lived approximately 100 generations ago. I found the conclusion satisfying, until another annoying question popped into my head — what about all the other generations in between?
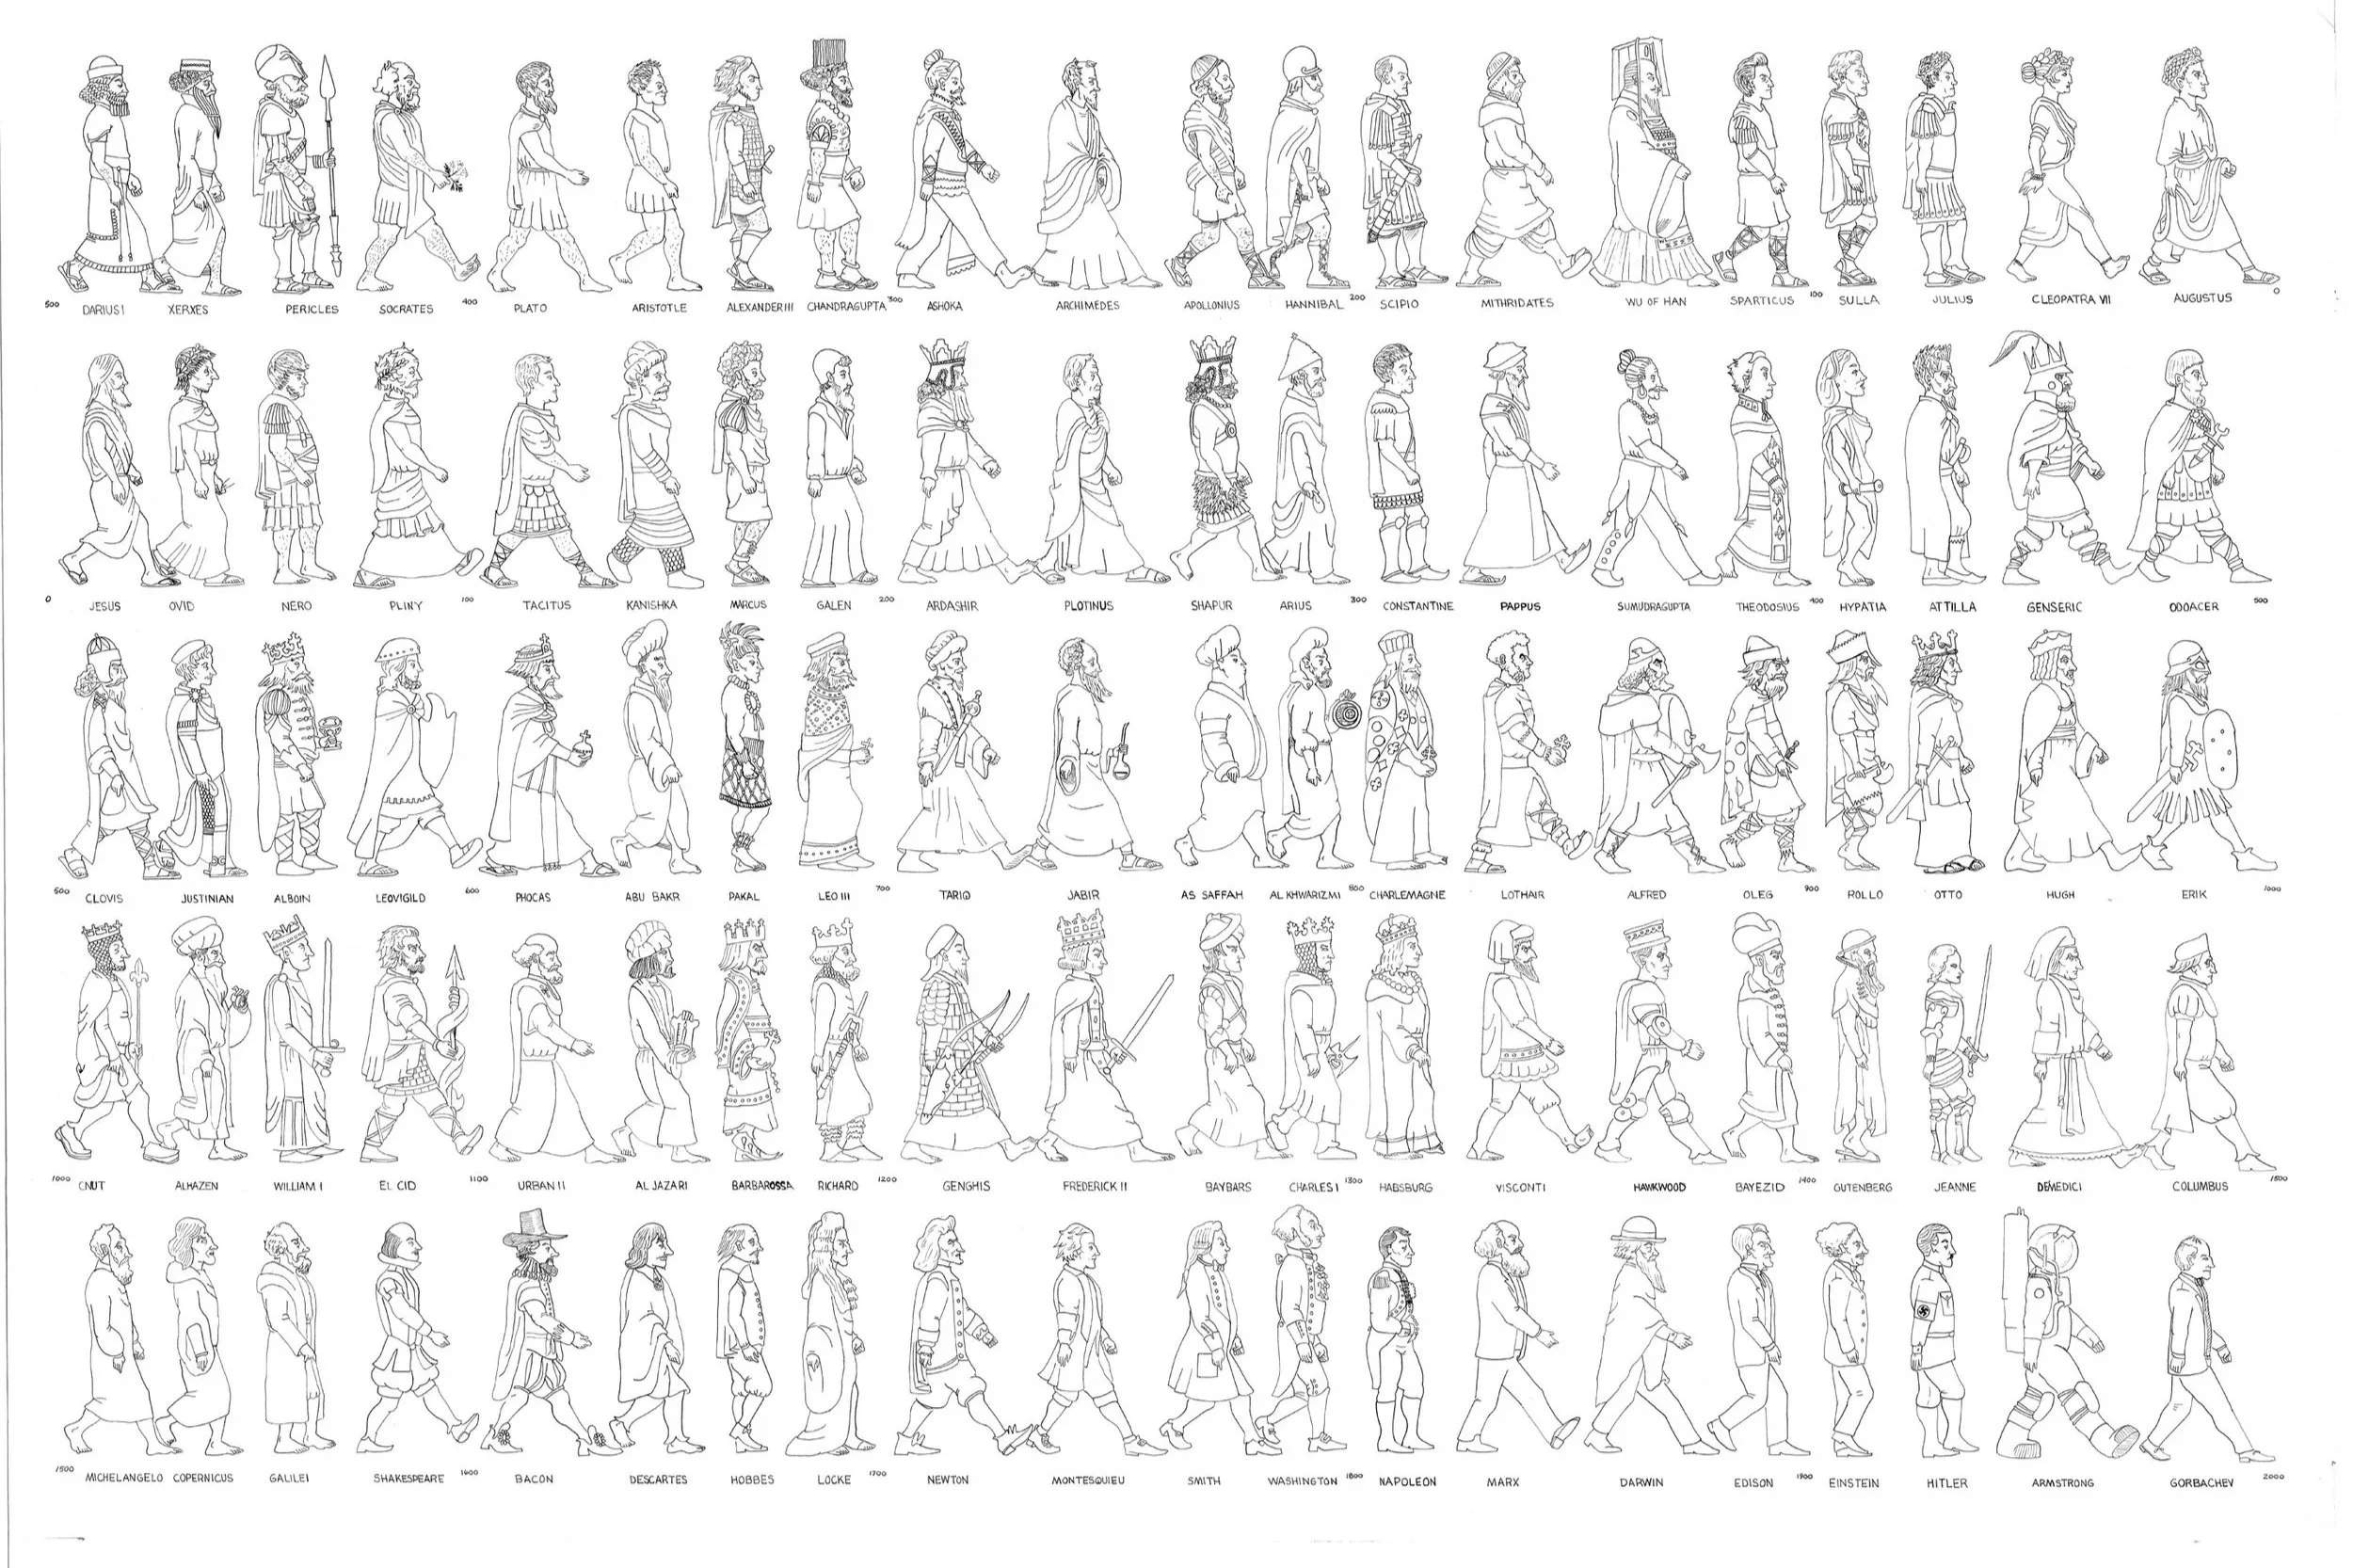
When I returned to my apartment in Brooklyn, I immediately began sketching out a generational timeline that would consume my attention for five months and introduce me to a cast of historic figures, places, costumes, and societies that formed a foundation for a deeper understanding of human activity.
That is the genesis of this chart. It was, and has remained, a deeply personal project for nearly 15 years. It is a doorway into a passion and comprehension for history that sits at the core of my being to this day.
So, how did I do it?
THE RESEARCH - The first step was determining who would populate my chart as representatives for their generation.
In addition to reading the standard works of ancient history (Herodotus, Thucydides, Livy, etc.) I decided to gain a historiographical perspective to learn how history is made. The Penguin Classics translation of On Writing History from Herodotus to Herodian was my guide.
I also wanted to see how others tackled the problem of examining history through a generational lens and creating charts of time. For this, I read Generations: The History of America’s Future from 1584 to 2069 by William Strauss and Neil Howe, as well as Cartographies of Time: A History of the Timeline by Daniel Rosenberg and Anthony Grafton.
THE LIST - Upon gaining a better grip on my mission, I decided that the “measure of the man” would be those who changed the global map.
I examined how political boundaries changed over time, then drilled down to the individual responsible. The “great man” approach that most post-Roman ancient histories took made my work much easier.
For the latter figures, I outlined a generational list of historical figures who transformed their world into a 5-by-10 grid of possible subjects. Admittedly, the process became messier after the Renaissance, when the tone and methods of history began to change and the world became more amalgamated and complex. There were also gaps, especially in the early medieval period, where there wasn’t a lot of change in the political landscape.
THE REFERENCES - What did these people look like?
To answer that question and keep to the historical accuracy, I attempted to identify three likenesses from contemporaneous sources, such as coinage, busts, and statuary. I then researched the historical costume each figure likely wore as a person of a particular social station. This was perhaps the most enjoyable but time-consuming leg of the process.
THE CREATIVE IMPULSE - My early attempt at sketching the chart seemed sterile.
I was trying to show progress and demonstrate that each generation leads into the next, and static figures side-by-side weren’t achieving the desired result. The solution came in the form of a horse.
One figure I was introduced to on this journey was Eadweard Muybridge, an 18th-century gentleman who was as unusual as the spelling of his name. It was he, not Thomas Edison, who created the first motion picture. He was attempting to unlock an age-old debate among artists— do all four of a horse’s legs lift off the ground simultaneously when running?
He very cleverly designed a contraption that would capture a fast series of photographs of a horse in motion. He found his answer. A horse indeed lifts all four hooves while running, but his greater discovery was what happened when the images were shown in quick succession — the illusion of motion. He went on to document many more such displays of motions from elephants, lions, pigs, sheep, and human beings. It was these plates that inspired me to display my historical figures in a “walk cycle.”
THE EXECUTION - While I certainly could have created the work as a digital composite, I was determined to create a work of fine art.
Rather than drawing and scanning each figure, then stitching them together in Photoshop, I painstakingly drew the entire chart by hand. My first attempt had many errors, so I tried again. My second attempt brought me to the Roman period, but I transposed two figures. My third attempt got me to George Washington until my ink smudged. My fourth attempt was rushed and sloppy, so I took a week-long break. It was my fifth and final attempt that is the piece I have framed in my living room.
THE UNEXPECTED RESULT - While my intended goal was to gain a human-centered view of time and learn more about historic individuals, I was surprised to find that the figures grouped into greater forms— lifetimes.
If a generation is 25 years and a lifetime is 75 years, then three consecutive generations must overlap. For example, Michelangelo was an old man, Copernicus was middle-aged, and Galileo was a young boy. And conversely, people whom I once believed were the same age because they occupied the same historical events were members of three different cohorts, like Benjamin Franklin, George Washington, and Thomas Jefferson. And these lifetimes formed greater strands of intergenerational history, such as Socrates, who taught Plato, who taught Aristotle, who taught Alexander, who taught Chandragupta.
This understanding has shaped the way I read and explore historical subjects, and I’ve kept it to myself for too long. That is why I’m sharing it here. In the coming months, I plan to revisit this project and develop it into a greater resource. Stay tuned.


